Generative plotting
Thousands of points rendered through two equations.
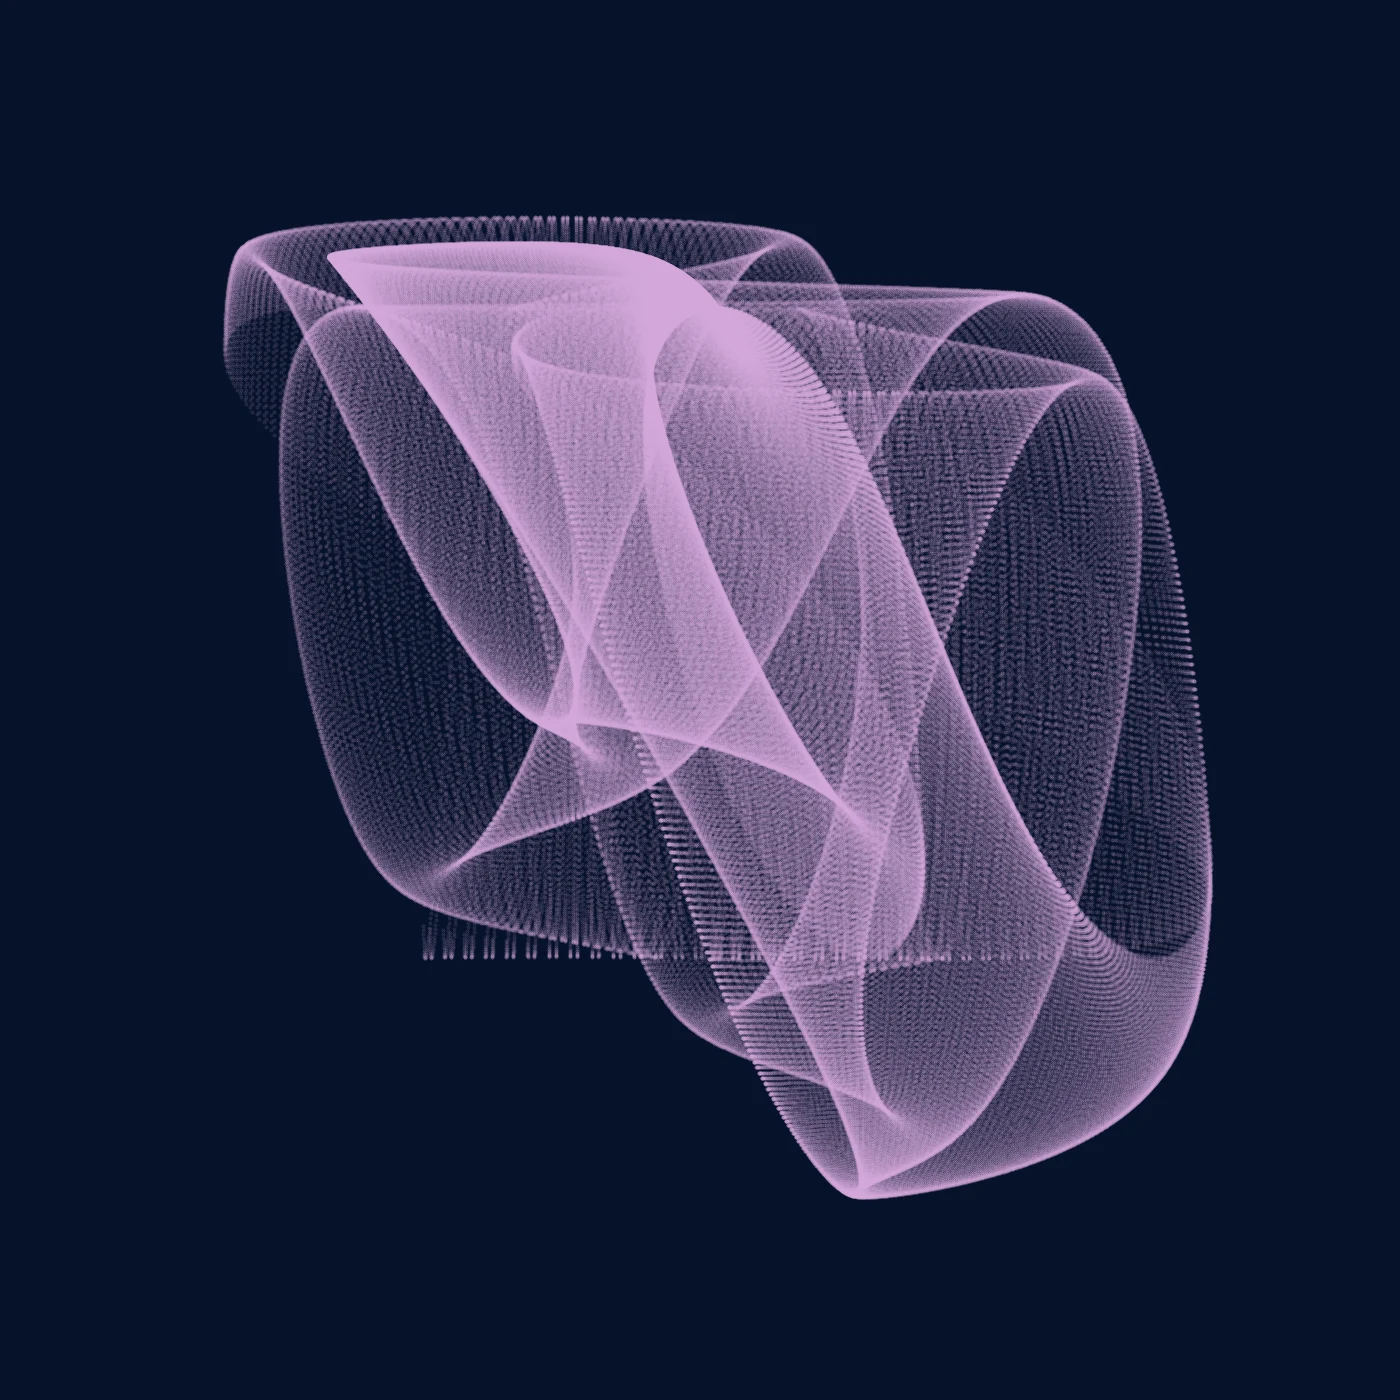
variation 82 · seed 894014
variation
projection
grid range±π
grid points394k points
palettes
markerpoint
spot size0.97
opacity0.19
rotation0°
shape
resolution
auto
1000 × 1000 · ~0.6 MBHow it works
Samila is a Python library for generative art. Every image comes from three things.
01
Two equations
A grid of points goes through two equations, f₁ and f₂.
f₁ = r·sin(x)·sin(y) + cos(x·y)
f₂ = r·tanh(x·y) − cos(x)·sin(y²)
02
A seed
A random number nudges every point. The same seed gives the same image.
seed = 894014
03
A plot
The points are plotted with matplotlib in your colors and shape.
f1 vs f2 · rectilinear
request
$ curl -o samila.png "https://samila.evanslack.dev/api/image?eq=82& seed=894014& proj=rectilinear& mode=f1_vs_f2& color=d8acdf& bg=06122a& marker=point& spot=0.97& alpha=0.19& rotation=0& size=1000"
Gallery
Pick one to open it in the editor.